
The Best 7 AI Prompts for Technical Documentation and Manuals
May 18, 2026
✍️ Introduction: From Spreadsheet Overload to Storytelling with AI
Every data analyst knows the struggle: you’ve got a spreadsheet full of numbers, but what your stakeholders really want is a story. They want clarity, context, and actionable insights—not rows and columns.
That’s where prompt engineering comes in. With the right AI prompts, you can turn complex datasets into polished summaries that sound like something out of a management report. In this guide, you’ll learn five powerful prompts for data analysis that help you convert data tables into concise, insightful paragraphs—perfect for executive dashboards, presentations, or client updates.
Whether you’re using ChatGPT, Claude, Gemini, or another AI assistant, these prompts will make your workflow faster, smarter, and more impressive.
📊 Why AI Struggles with Raw Data (and How to Fix It)
When you paste a table into ChatGPT or Claude, it often gives vague summaries (“Sales increased in Q4”) or misreads the structure entirely. The issue? Most AIs need clear context and role instructions to interpret numbers correctly.
With structured prompt templates, you can guide AI to:
- Identify trends, patterns, and anomalies
- Translate metrics into plain language
- Compare categories or time periods
- Suggest potential causes or next steps
That’s exactly what the following five prompts are designed to do.
🧠 The 5 Best Prompts for Data Analysis
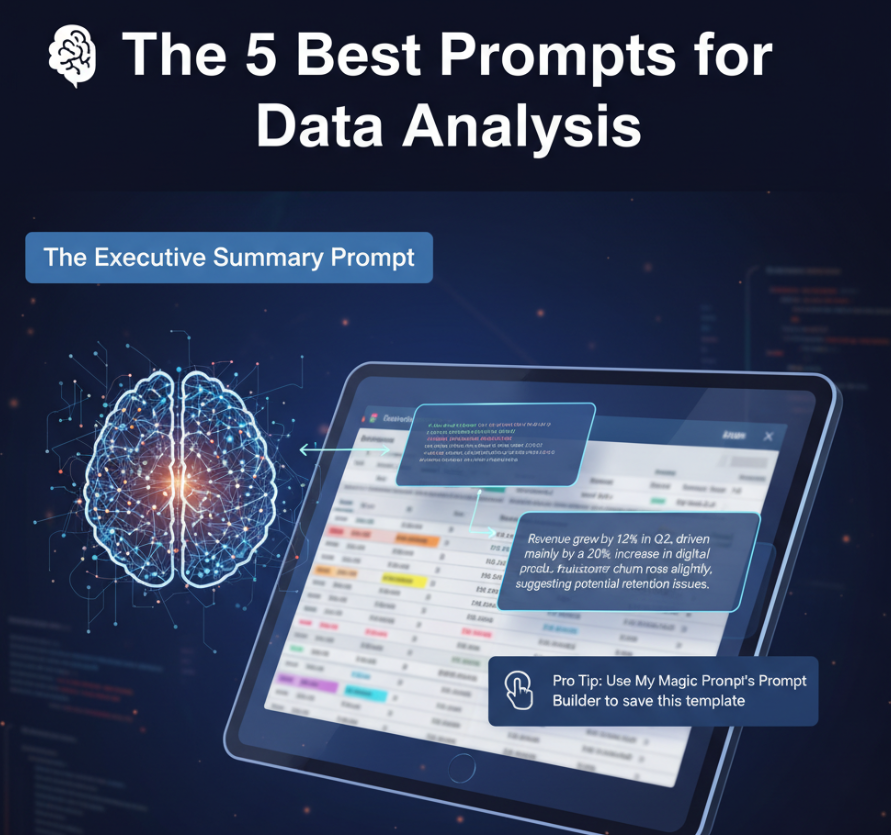
1. The Executive Summary Prompt
Purpose: Turn raw tables into concise, boardroom-ready insights.
Prompt:
You are a senior data analyst. Review the table below and write a professional summary for an executive audience. Highlight key trends, growth areas, and anomalies in clear, concise language. Avoid restating every number—focus on insights.
Example Output:
“Revenue grew by 12% in Q2, driven mainly by a 20% increase in digital product sales. However, customer churn rose slightly, suggesting potential retention issues.”
Pro Tip: Use My Magic Prompt’s Prompt Builder to save this template and adjust tone or audience instantly.
2. The Trend Analyzer Prompt
Purpose: Identify patterns over time and explain fluctuations.
Prompt:
Analyze the following dataset and describe trends, peaks, and declines across time periods. Explain what might be driving each significant change. Write your answer in an accessible, narrative style.
Best For: Monthly sales, web traffic, engagement rates, or campaign metrics.
Tip: Use the Magic Prompt Chrome Extension to generate trend-focused variations automatically.
3. The Comparison Prompt
Purpose: Compare multiple categories, products, or regions.
Prompt:
Compare the performance of each category in the table below. Identify which ones are overperforming or underperforming, and explain why these differences might exist.
Use Case: Product line performance, regional reports, department KPIs.
AI Tip: Add context like “Assume these results are for Q3 2025” or “Assume marketing spend was constant across regions” for more accurate reasoning.
4. The Insight Generator Prompt
Purpose: Ask the AI to move beyond summary and offer actionable insights.
Prompt:
Based on the dataset below, identify three key insights and one actionable recommendation for improvement. Use business reasoning and clear, confident language.
Example Output:
“High customer growth in Asia suggests expanding localized marketing could further boost adoption. Meanwhile, North America’s flat trend indicates saturation risk.”
Pro Tip: Store this as a reusable template in your My Magic Prompt workspace for all your analytics reports.
5. The Contextual Story Prompt
Purpose: Combine data insights with narrative for report writing.
Prompt:
You are writing a short report based on this table. Create a clear, engaging paragraph that tells the story of the data, linking the numbers to possible business or market factors. Avoid jargon and make it easy to read.
Ideal For: Reports, newsletters, client briefs, or internal updates.
Example Output:
“Customer engagement peaked during the summer sale, with conversion rates doubling compared to last quarter. However, retention rates dipped post-campaign, highlighting the need for stronger loyalty initiatives.”
🧩 Bringing It All Together: Use My Magic Prompt for Data Workflows
Manually crafting these prompts every time can be time-consuming. With My Magic Prompt, you can:
- Save and organize your favorite prompt templates by use case (e.g., reporting, BI, or sales)
- Instantly generate AI-ready prompts that match your dataset’s context
- Experiment with tone (executive, analyst, storyteller) in one click
👉 Try the Magic Prompt Chrome Extension and see how easily it transforms raw data into polished insight summaries.
❓FAQ: Prompts for Data Analysis
1. What makes a good prompt for data analysis?
A good prompt clearly defines the role of the AI, specifies the output format, and provides enough context about the data. Without that structure, AI often produces generic summaries.
2. Can AI misinterpret data tables?
Yes. If your table lacks labels, context, or consistent formatting, AI might misread values or relationships. Always clean and label your data first.
3. How can I make my AI outputs sound more human?
Add tone cues like “for an executive audience” or “in a conversational tone.” Tools like My Magic Prompt make it easy to tweak tone instantly.
4. What’s the difference between summarizing and analyzing data with AI?
Summarizing describes what happened; analyzing explains why it happened. Prompts that include reasoning or causal language yield deeper insights.
5. How can I organize all my AI prompts efficiently?
Use My Magic Prompt’s template library to tag, categorize, and reuse your best prompts for consistent results across projects.
🤍 Turn Numbers into Narratives with AI
Data alone doesn’t drive decisions—insight does. With these five prompt templates, you can help AI do more than summarize numbers: it can tell the story behind them.
Start transforming your data storytelling today at My Magic Prompt—your toolkit for smarter, faster AI workflows.